And he left just when we had grown accustomed to “New stock market high!” headlines with a growing enthusiasm about 2020. So, why the December 30 drop?
Is it a simple adjustment or the result of thin, holiday trading? Or is it a sign that the steady new-high rise was the result of delayed selling that will hit the market in January? Or, worst case, are investors beginning to see a return of slower growth?
Well, one day’s market move certainly can be given too much weight. However, there is another question that has built as those new highs were doled out: Is it too late to buy? Behind this query is the sense that the new highs mean overvaluation with increased risk. On the other hand, did they set the stage for a market dip that will allow investors to increase their underweighted stock holdings?
The short answers:
First, year-end trading can provide limited information about the market trend ahead. There is lighter than normal volume plus there are tax effects, particularly selling losses ahead of the new year and postponing profitable sales until the new year arrives. That means December moves need to be judged after January moves happen.
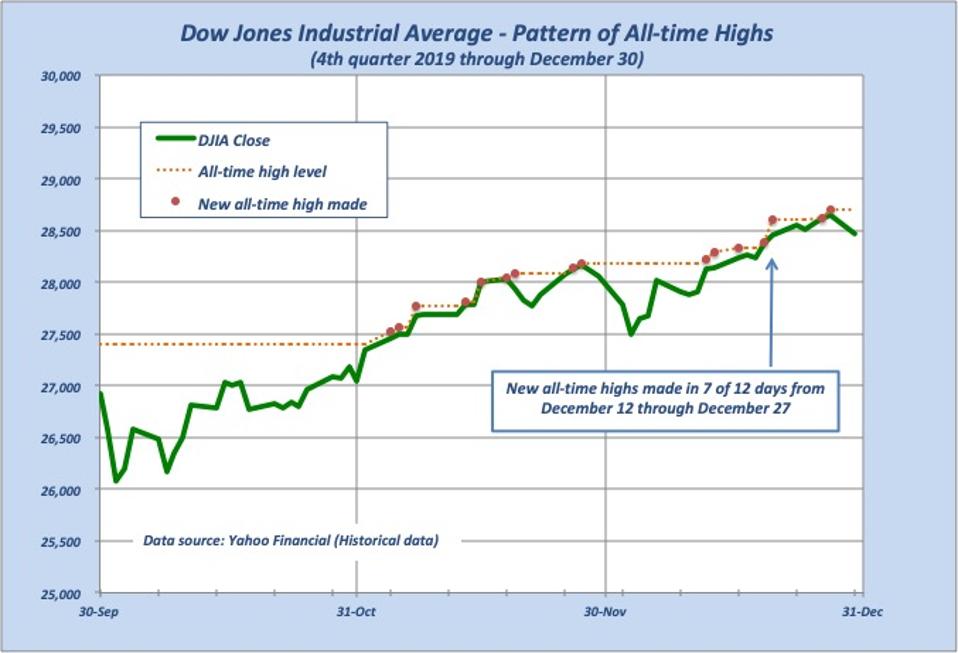
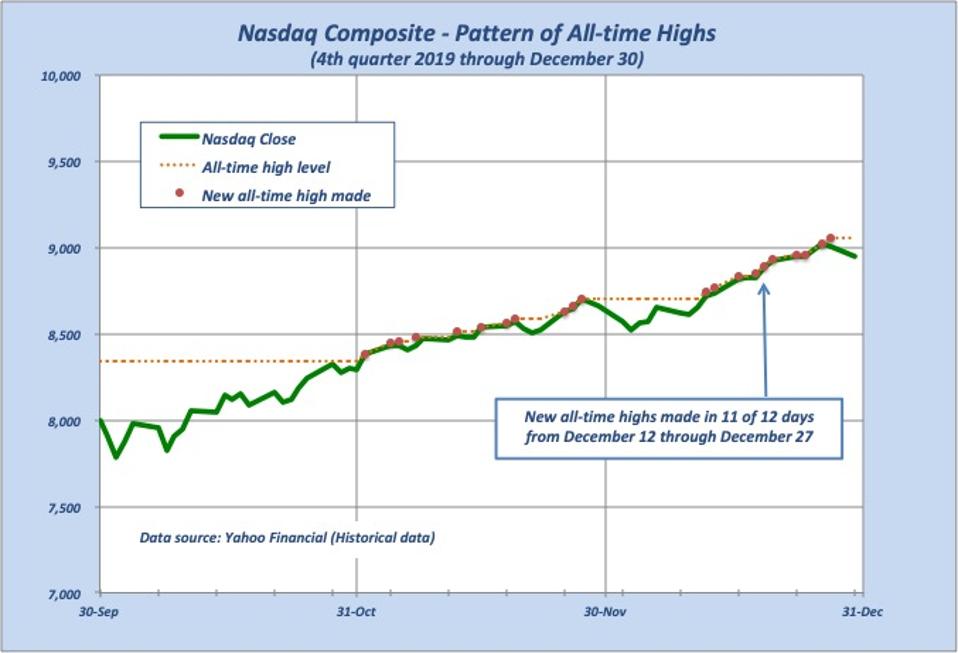
Second, the steady new-high headlines over promoted what the stock market was actually doing. The media would float between the three major U.S. indices (S&P 500, Dow Jones Industrials and the Nasdaq Composite), seeking the most titillating result. There were a number of days when one or more indexes failed to make a new high or barely squeaked over the hurdle. (For more information, see tables and graphs below.)
Third, we look to be moving into less “stock market” rationale and more sector/industry/company thinking. That means that the market is becoming more of a conglomeration of various component trends, with the daily average carrying less meaning about, say, tariff talk or Fed guessing.
Fourth, much of the overall index rises in the fourth quarter are attributable to good earnings reports and economy/business news. So, overvaluation and over-optimism are not visible. Of course, those issues will come sometime in future, but current investor attitudes and actions are far from such a market environment.
Fifth, yes, this could be the beginning of a dip – or not. In spite of the extremist fears and warnings, there do not seem to be any reasonable worries that would cause the stock market to drop even 5%, much less “correct” down 10%. As always, uncertainties exist, but not serious issues like slow growth. (Although the economists, fresh from their debunked recession forecasts, have picked up that mantle. As I have explained before, economists are great explainers of what happened, but terrible forecasters of what will happen, so they offer a valuable contrarian view – in this case, better than expected growth.)
How the numerous new highs’ pattern is less dramatic than the headlines that accompanied them
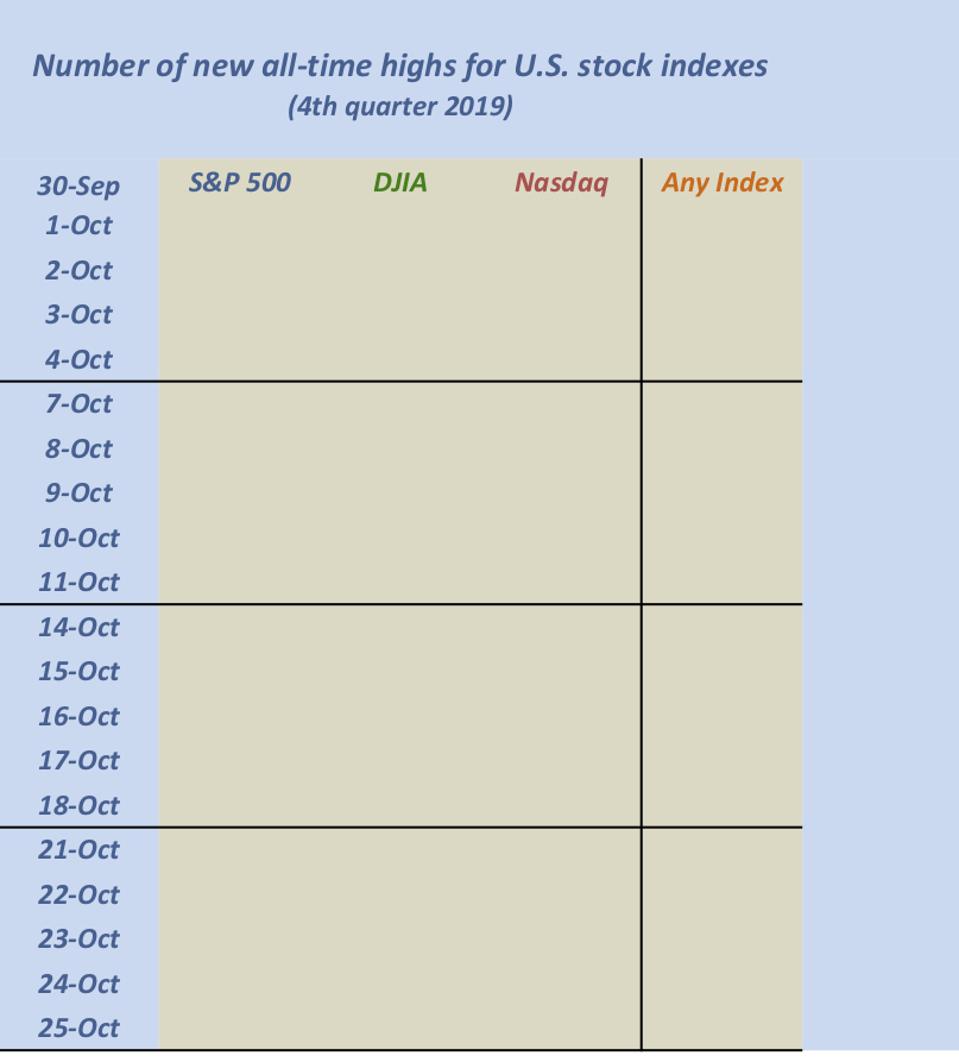
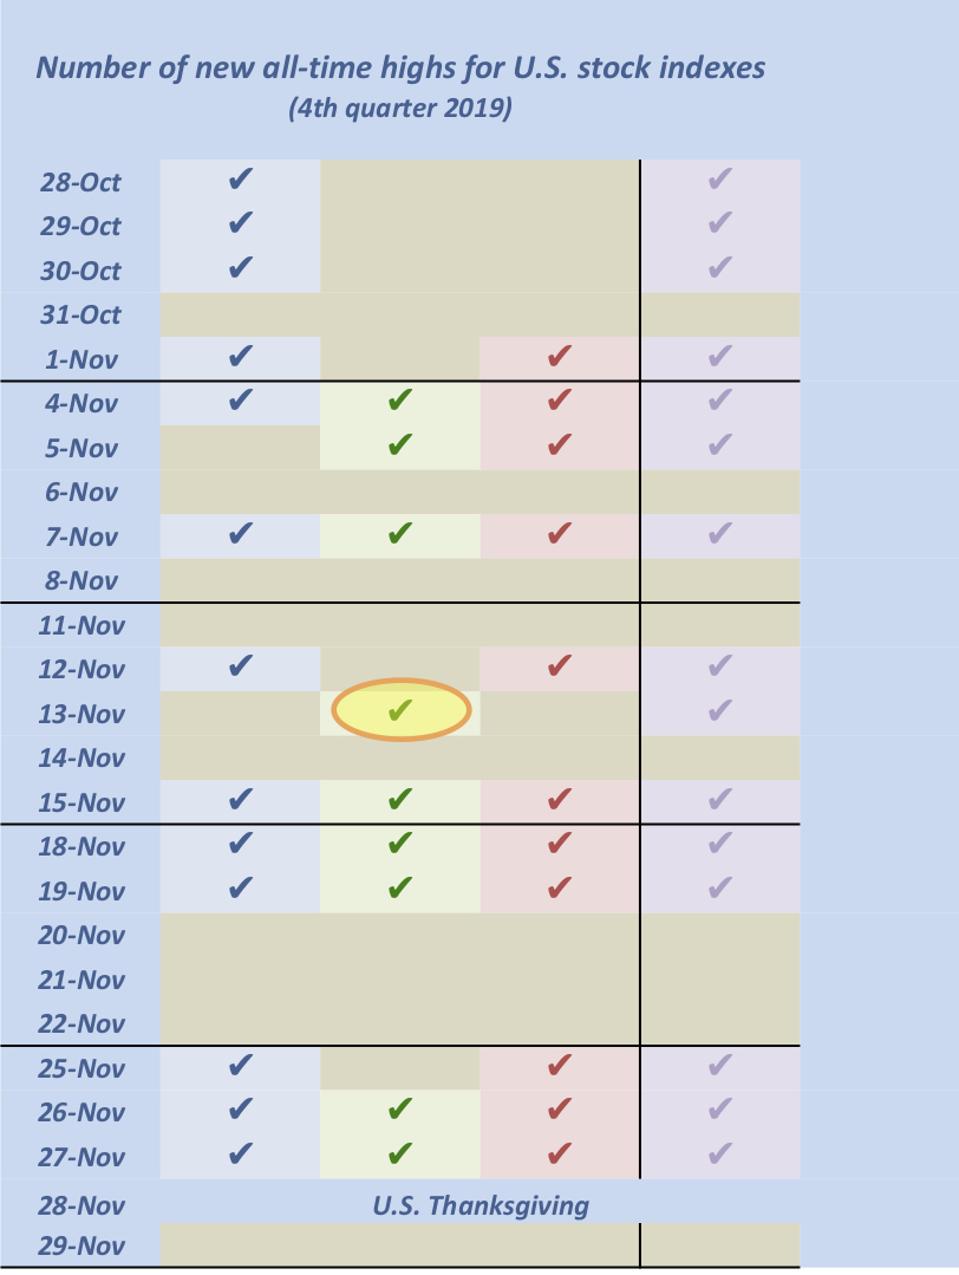
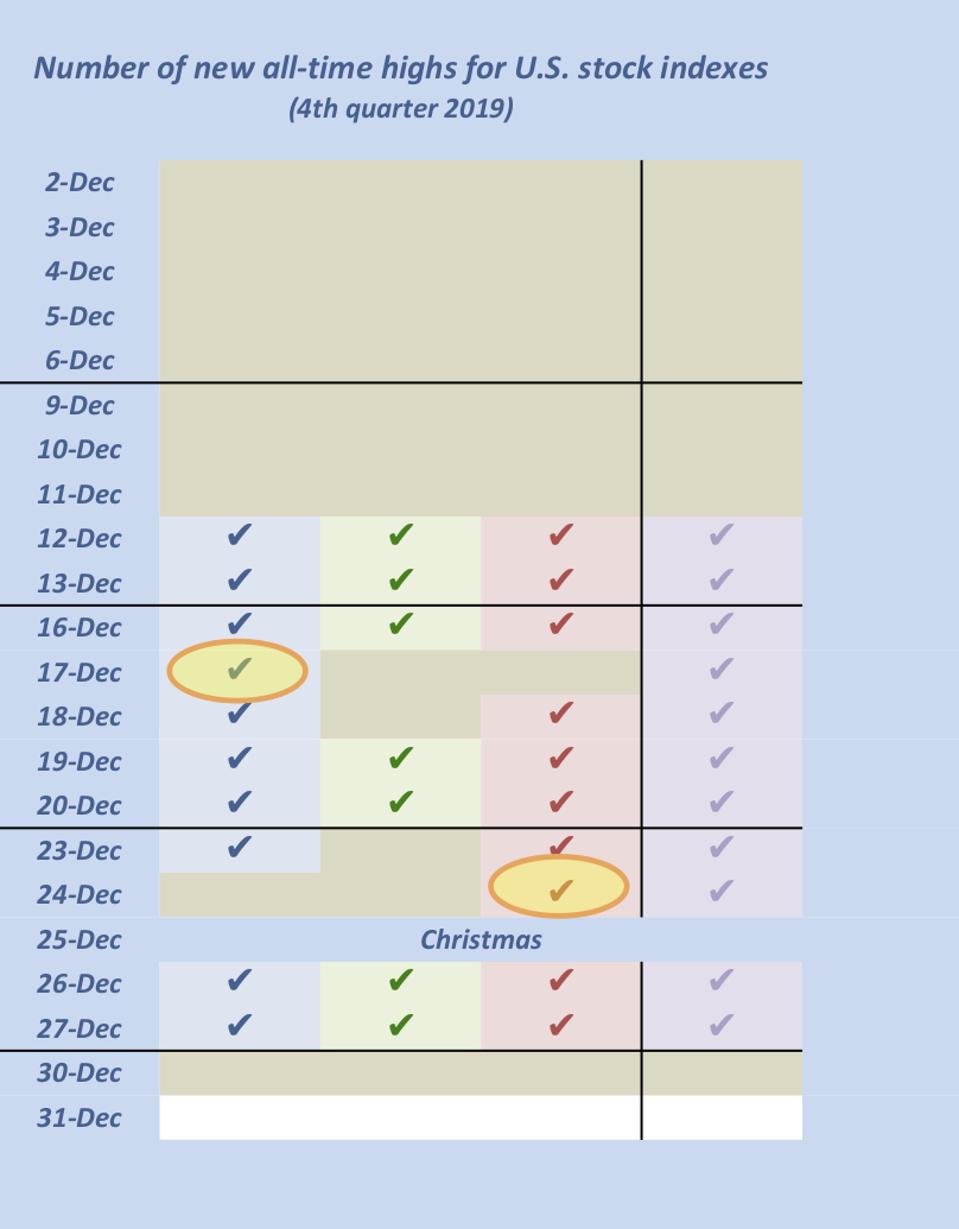
Below are three tables and three graphs showing how the new highs occurred during the fourth quarter.
In the following 3-part table, the first three columns are for the main indexes, with check marks showing the days each hit a new high. The fourth column is the media new high view, showing when any of the indexes touched a new high. (Circled index check marks show when only one index hit a new high. And, yes, the first table is empty because no new highs were made until October 28.)
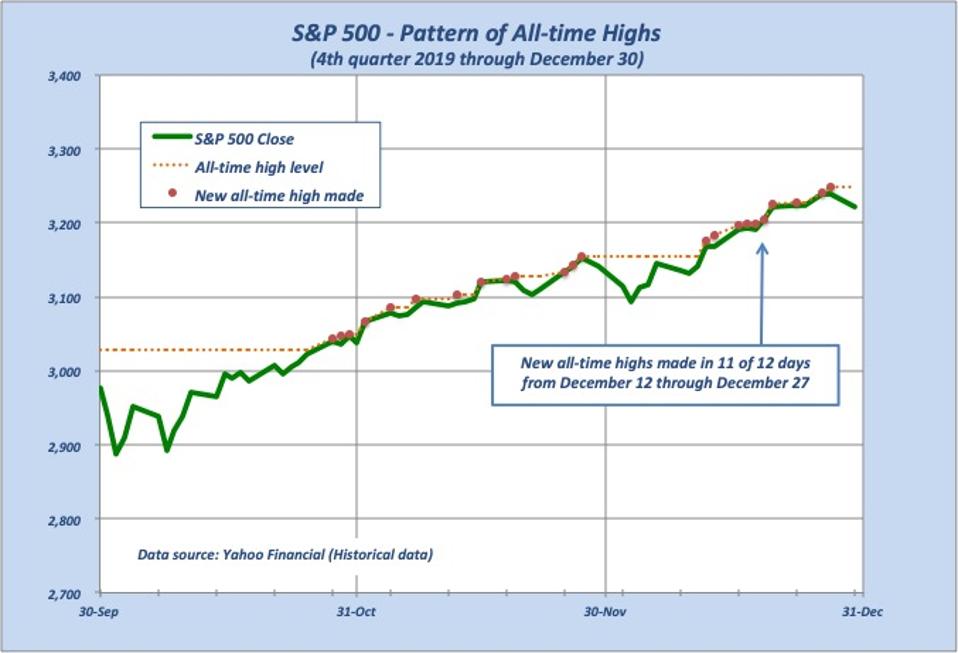
In the following graphs, each index’s daily closing is shown (solid line) along with the all-time high at that point (dashed line). The circle plots show the point a new all-time high is made. Note the number of mini-rises that occurred during the 12-day run, as well as the long stretches of no new highs.
The Bottom Line
Happily, the December 30 drop kills the media’s 12-day string of new high headlines. They created too significant a view of what was happening, raising questions that accompany more active and high performing market environments.
Therefore, a good approach is to dismiss that 12-day run and to not worry about the one-day drop ballooning into something large. Instead, focus on companies and their stocks (either by doing it yourself or by using an active adviser or active mutual fund manager).


