We recently talked about how fast you should trade, and previously discussed the basics of routing. Today we begin to look at the intersection of these problems: the many tradeoffs in the life of an order.
Parent and child orders
Almost all large orders are “worked.” An investor trying to buy 100,000 shares would have outsized market impact if they displayed the entire order to other traders. Even in the days of human floor traders, large orders were split into smaller trades to show to the floor. Today, algos do that more efficiently than ever.
Professional traders refer to the investor’s full order as the “parent” and each worked slice as a “child” order. That makes sense because the performance of all the child orders affects the cost of the parent.
What an algo decides to do with each child order is where the fun (and opportunity cost) begins. Each of the examples below assumes we’re a buyer:
Capture spread or liquidity?
The first choice is whether to lift the offer now (“take” liquidity), or try to buy the stock cheaper by joining the bid with a limit order (“make” or provide liquidity).
Although joining the bid will often save a whole spread, it adds uncertainty, in both time and price the order gets filled.
- Time uncertainty: Although not all stocks have long queues, joining the bid puts you at the back of the queue, which will make your trade slower.
- Price uncertainty: One of the worst things that can happen to a buy limit order is the market rises before you get your trade done. The algo will need to raise its limit to the new bid, maybe more than once, resulting in both a slower trade and a fill price worse than take price available at the start of the route (Chart 1).
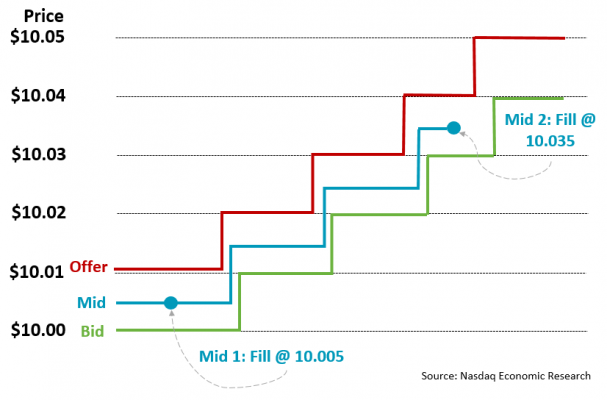
Chart 1: Examples of the different outcomes for market (taking) or best bid (making) orders

We show each of these outcomes in Chart 1 above. The market at the start of the child order is bid $10.00 and offered $10.01. We show how, in this example, the bids and offers rise over time.
A take order has a nearly certain fill on exchange at $10.01 (TAKE fill).
In contrast, a make order might need to wait some time for a fill. That slows down how fast the parent order is able to trade, but may save a whole cent (see MAKE 1 fill).
But there is also the chance that prices could rise before a make fill, requiring the algo to chase the stock before a fill at MAKE 2 or even MAKE 3 fills. That is known as an opportunity cost.
Working out whether the make or take routes, on average, get the cheapest execution price is important. It involves quantifying opportunity cost - which in this case means computing an average price that all of the MAKE executions combined. Note that at each price level you expect more fills, so the probability of a MAKE 3 fill is typically much smaller than for fills and the bid, or Bid+1 tick, which we show with the thickness of the blue line.
If the offer falls it guarantees a Make fill at the bid, but also adverse selection which we’ll discuss later.
Which exchange matters?
There are more than 13 different exchanges in the U.S. and market rules mean a security can quote and trade on any of them, regardless of the exchange on which it lists.
But there are some factors that increase the probability of fills.
Exchanges that focus on economically attracting liquidity are better at attracting quotes than others. Knowing which exchanges have shares at the best offer is important for Takers. You want all your trades to fill as close to simultaneously as possible. Otherwise early fills may signal your order is coming to the market, resulting in sellers and price-slide orders like DPEG moving limits higher, so your take only gets a partial fill.
Taking so you don’t signal requires routing roughly as fast as the speed of light. Given nothing can travel faster than the speed of light (yet) sellers can’t beat you to other markets even if they detect your trading footprint in the first market you trade.
Chart 2: Some markets are at the best offer more than others
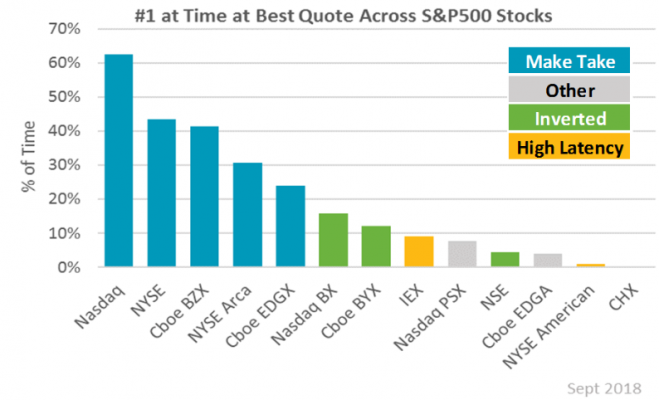
For makers, the duration of queues in minutes at different venues matter, as longer queues not only slow the trade down, but also make it more likely the price will rise without any fills (like Chart 1).
In general, inverted venues tend to get fills faster regardless of the quantity of shares in their queue. That’s because they are economically cheaper to trade for takers. However, the difference in explicit (exchange) costs is close to half of a cent.
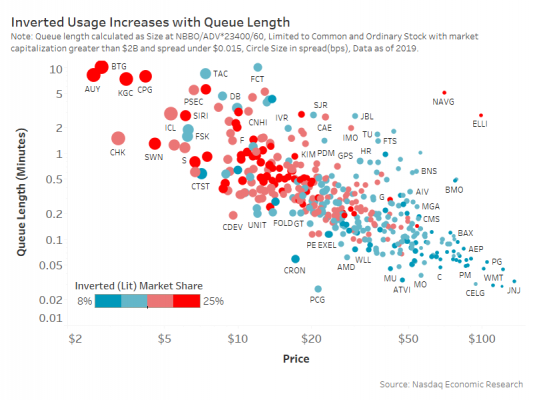
Data shows that inverted venues are used more when spreads are wider and queues are longer (Chart 3). However even then, the cost-benefit isn’t always positive, even if you need to trade fast.
Chart 3: Inverted venues are used more when spreads are wide and queues are long
Lit or dark?
One other feature of a limit order is that they are “public.” The alternative is to use resting orders that are not displayed, which you can do with hidden order types on exchange, or in dark pools.
That creates another trade-off.
Public quotes let sellers know you are there, which attracts liquidity to you. But it also sends information of your buy order to the market, which might make prices rise, sometimes without you getting filled just like we showed in Chart 1. That’s called “signaling.”
Looking at the price move after your limit order posts and comparing that to when you have no orders in the market should help quantify the cost of signaling. In fact a KCG study even found that posts to inverted venues signal more than the same order in arriving in a maker-taker venue. That in turn offsets some of the benefits from the queue priority they offer.
In contrast, a hidden order may remain hidden even as sellers trade actively on exchange.
Midpoint or near-touch?
The price you rest Hidden or dark orders can also be important. Hidden orders can also rest a “mid-point,” which is the price in between the bid and offer.
Although they are hidden, they have queue priority because a seller is more likely to compromise on a half-spread before crossing the whole spread too. That makes fills faster.
The trade-off is that spread capture is also reduced, by a half cent (if the spread is one-tick) or more.
It’s also possible that large institutions are more likely to use these order types than “informed” high-frequency traders who need certainty of fills, and consequently focus their take trades in lit markets.
But there are many opportunity costs that can be difficult for investors to measure with hidden orders:
- The fact that the order isn’t advertised might mean that trades happen at lower bid prices. Slowing down the hidden order and missing out on even better prices that a limit order may have received, perhaps missing better fills and also increasing opportunity costs.
- To offset that, some dark pools may advertise using IOIs or allowing pings. But that adds to signaling costs.
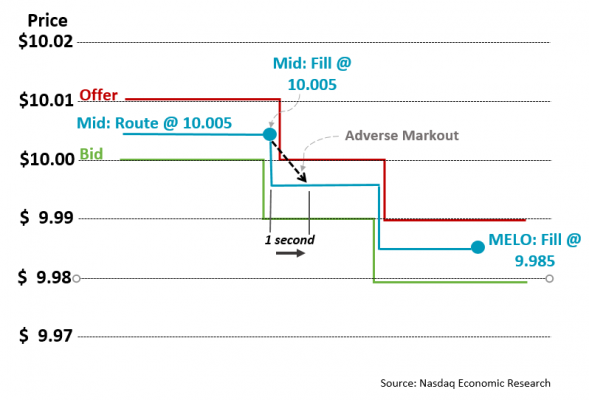
- Mid orders also float with prices. Although that’s convenient, it’s possible that an initial fill (Mid 1 in Chart 4 below) actually signals the existence of your buy to a seller. The seller may in turn remove their lit quotes from the market until prices rise, returning to sell more at higher prices (Mid 2). Tracking this requires detailed routing data.
Chart 4: Examples of how a Mid-point order may work
Hiding also makes it harder to quantify these opportunity cost-benefits. By definition there is no public data about pings and indications, and there is also limited information sent back to most investors about dark routes that are not filled. This is important if the fill you actually get is Mid2 fill, as most data will show that as 50% spread capture, even though it’s much worse than what a take order would have paid at the start of the order.
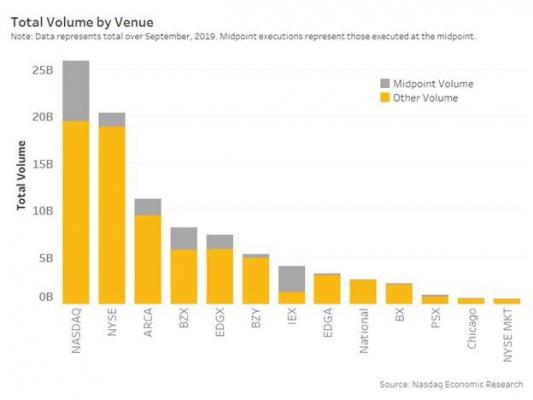
One benefit of exchange mid-point orders is that Exchange mid-point orders should execute faster, especially when that exchange has shares on the NBBO. That’s because sellers on the exchange will trade with the mid-point order as they try to hit lit bids. Data shows some exchanges have quite a lot of mid-point liquidity.
Chart 5: Mid-point orders by venue
What dark pool works best?
With over 50 different places to source liquidity, including around 30 dark pools, it’s tricky for an algorithm to know where to route first, especially for dark pool orders.
There are two sides to every trade, and it’s easier to consider this problem from the perspective of the taker.
Why would a taker route dark?
One answer is cheaper fills, thanks to all the mid-point orders. The trade-off is that the dark pool you select may have no shares for sale. You could sequentially send a child take orders to one dark pool after another, but that takes time and allows others to react to small trades and potentially cancel other orders, resulting in partial fills and slower trading.
There are a few ways algos try to increase the probability of fill:
- Dark pools with a lot of sellers are more likely to have shares offered. Market share can indicate a starting point.
- Often large orders are worked by the same broker over the day, making a venue with fills early in the day more likely to also have fills later in the day. Tracking this is often called a “heat map.”
- Spreading a take order across multiple dark pools increases the chance of finding a pool with a seller. The trade-off is splitting your order up even more, and risking the signaling that comes from a partial fill.
Of course, a dark pool might use “indications of interest,” which share a little information about the existence of an order. That increases the probability of fill for both makers and takers, but leaks information about a limit order. Whether that’s good depends how much you want to hide.
Avoiding adverse selection and using speed bumps
All traders react to new information. Interpreting the changes in the supply / demand curve in Chart 1 from last week is what drives price discovery. It also improves passive trade performance because it minimizes adverse selection.
Adverse selection is the opposite of the opportunity cost highlighted in Chart 1. It occurs when a buy order is filled at $10.00 only to see the market get cheaper. For a market maker, closing out the position will NOT capture spread and may record a loss. For a very slow trader, waiting for cheaper fills can also improve performance.
Importantly, not all adverse selection is bad. For an order that needs to trade faster, fading the current bid price as the market weakens may unintentionally avoid natural liquidity. It will also systematically lose queue priority, and that slows the trade down. It may even result in higher alpha decay and shortfall over the whole day if the stock consistently rebounds and trends higher.
Chart 6: Adverse selection occurs when you get a fill that is worse than the future price; avoiding adverse selection slows fills but can lead to price improvement.
Some obvious signals algos might use to decide where prices might be headed, and so where to route an order, include:
- Midpoint trades on the SIP indicate an order that might still be hiding.
- Shares on the bid indicate a buyer, and more shares show more buying.
- Bids on inverted venues signal that a buyer is more urgent as they’re paying for queue priority.
It’s also important for algos to consider that adjusting limits frequently results in lost queue priority each time.
Some exchanges also offer order types to help avoid adverse selection. IEX’s DPEG uses depth data from other exchanges (mostly maker taker venues) as a sign that their mid-prices might need to change. Their speed bump then gives them time to re-compute their own limit prices and fade midpoint orders to try to minimize adverse selection should the seller route to their venue too. The trade-off is that’s bad for takers who might pay a whole spread for midpoint orders on IEX, but it’s good for very passive traders.
Nasdaq’s own MELO order also avoids adverse selection by remaining hidden as an aggressive taker sweeps our market, allowing the MELO to float down to the new NBBO.
What does this all mean?
In short, trading is a series of trade-offs, and each choice has different costs to investors and market quality.
It’s also unlikely that any algo only makes, takes or hides.
In reality, a single child order might start hidden, post on the bid, move to an inverted bid before finally sweeping dark or even lit pools if it needs to finish to keep up with how fast the investor wants to trade (Chart 6). In fact, a study in Canada found that the average institutional trader takes a net of just 20% of the time. However we also know that few traders are average.
Chart 7: The trade-off between cost and certainty is on a sliding scale
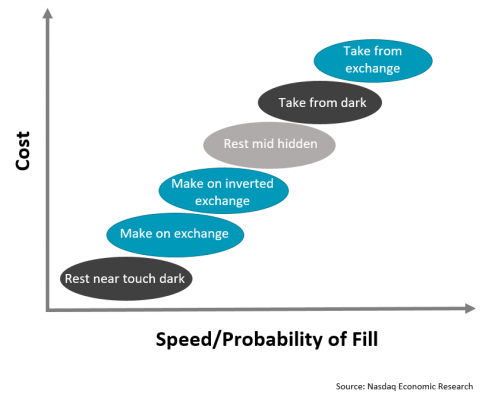
No single metric shows an optimal fill. Not all adverse selection is bad. Fade creates winners and losers.
The trick is to know how fast should you should trade and pick an algo that is tuned to that.


