The Oil & Gas Exploration & Production ETF (XOP) is the one massive eyesore among the S&P 500 (SPY) sectors and continues to sit at a sizeable double-digit decline for the year. This is despite the S&P 500 being up roughly 20% for the year, and many of the stronger sectors like technology (XLK) up over 30%.
While the bulls have played lethargic defense all year in the Oil & Gas Exploration & Production ETF, some indicators are suggesting that the bears may be overstaying their welcome. The index's rate of change is now near the same levels where it sat during the 2009 plunge and the 2016 pounding, sitting at a 52-week rate of change of (-) 40%. I see no reason to rush out and buy here, but I do believe the index is one worth monitoring with the sentiment as bad as it is.
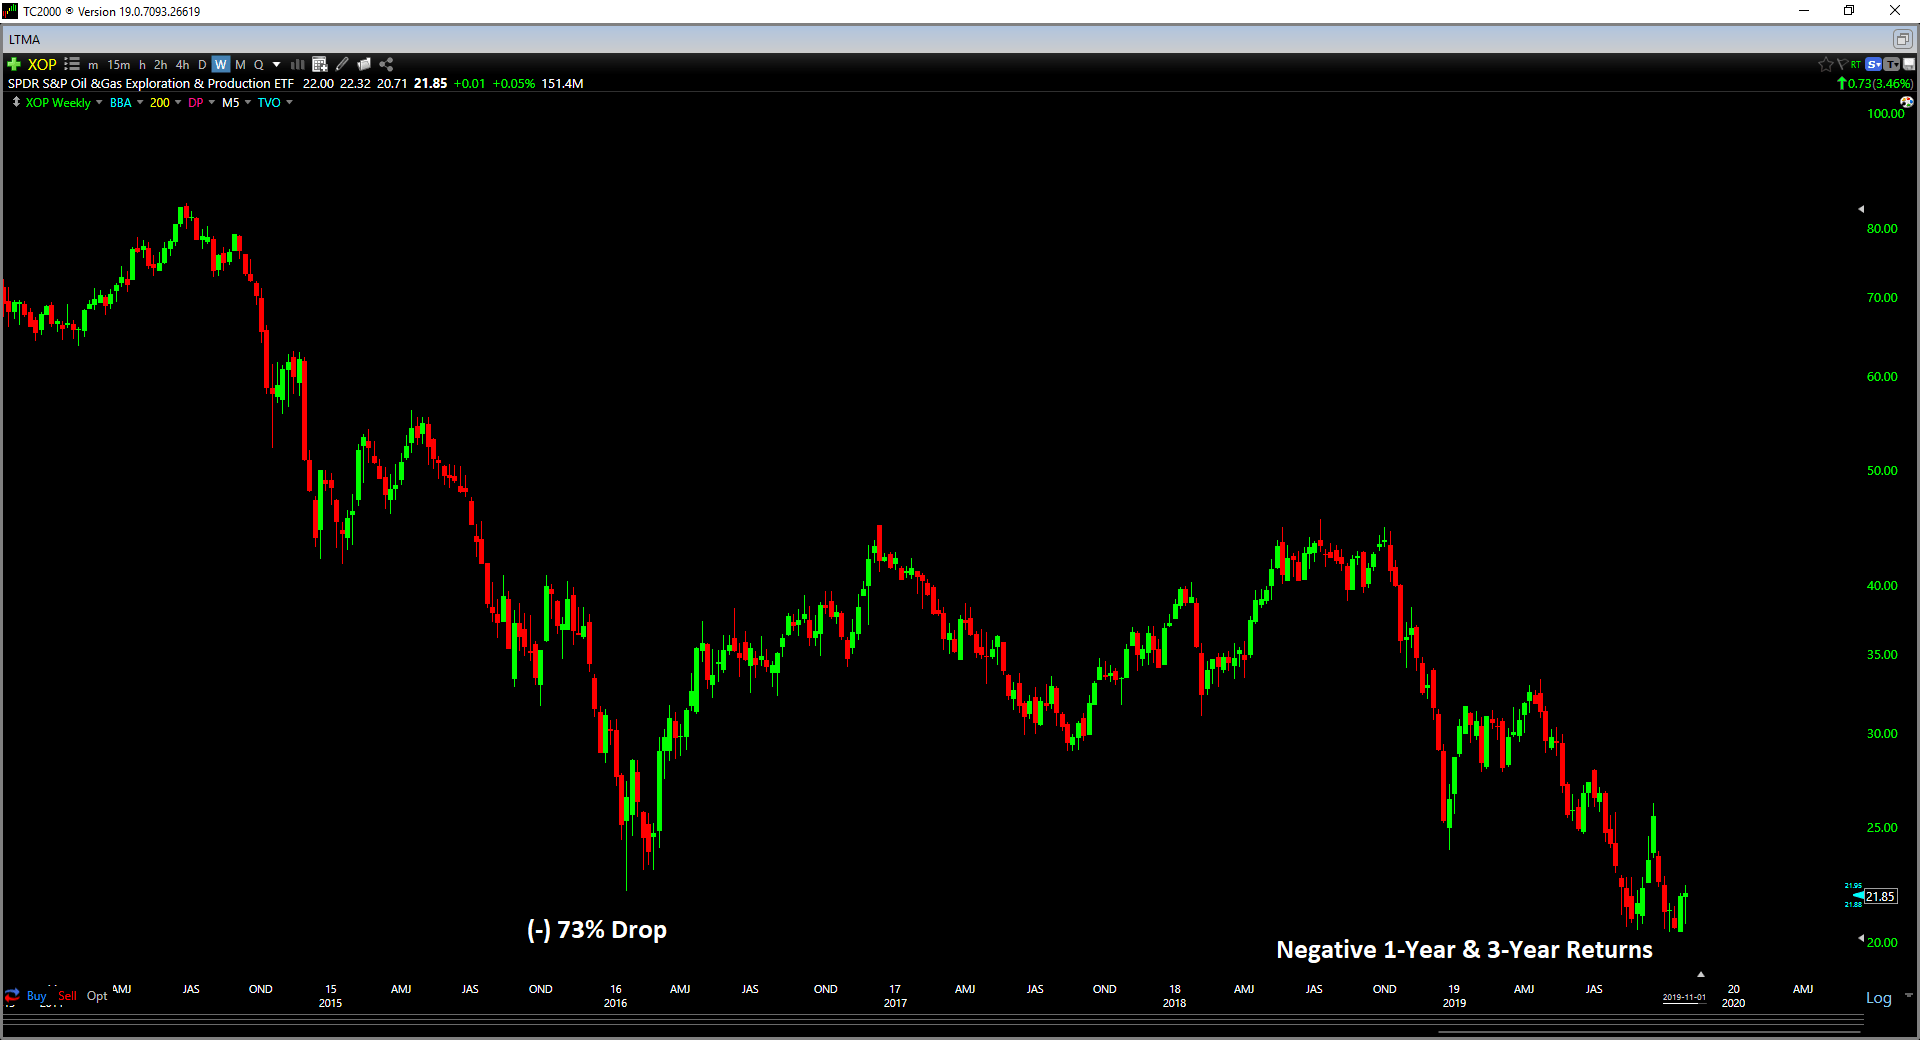
Investors in the Oil & Gas Exploration & Production ETF have had a tough ride the past year, and the length of this decline has likely led to absolute disgust with the sector. While the index is down just 17% for the year, it's also down 55% from its highs only one year ago.
Even worse, the index has a negative return since the 2016 bottom on the S&P 500, while most sectors have seen double-digit gains since these lows. For those that went with the Technology ETF at the 2016 bottom instead of the Oil & Gas Exploration & Production ETF, investors in technology have now outperformed by nearly 125%.
Given this pathetic 1-year and 3-year performance, I believe it's likely that some investors have sold out of pure disgust as almost no one is making money here from the long side. When disgust is at multi-year highs, and virtually no one wants anything to do with a sector, it's often time to at least pay attention.
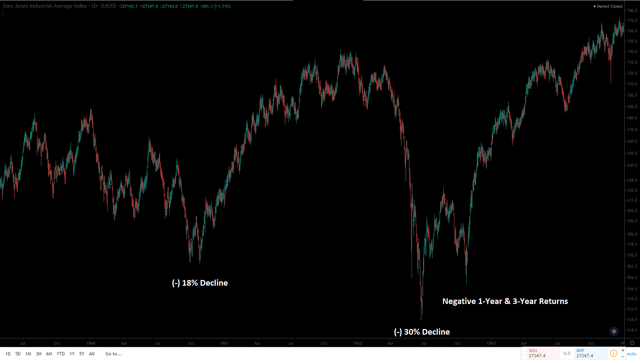
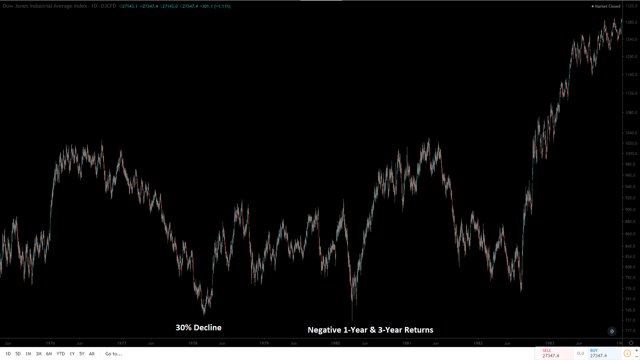
I would argue that sentiment was likely similar in the 1959 through 1962 period and the 1976 through 1980 period for the Dow Jones Industrial Average (DIA). Investors had to suffer through two significant declines in a three to four-year span, and both periods saw negative 1-year and 3-year returns. When a correction is not only sharp, but also drags on, it often makes investors rethink their investment approach, or why they're investing at all.
Irrationality and disgust at lows often create opportunity at some point. I am not suggesting that the Oil & Gas Exploration & Production ETF should see a recovery similar to the 1962, 1980, or 1982 bottoms in the Dow Jones Industrial Average. Instead, I am merely pointing out that we're likely seeing despondence currently. This can provide an opportunity for those who were fortunate to be on the sidelines.
Enter your text here...
But, why now of all times to take a look at the Oil & Gas Exploration and Production ETF? Haven't we been lying at these lows for months now? Yes, and this has likely served to grind down the last investors that thought they could stomach this decline. The other reason is that some indicators are suggesting we might be seeing a turn under the surface of the index. Let's take a look:
52-Week Lows
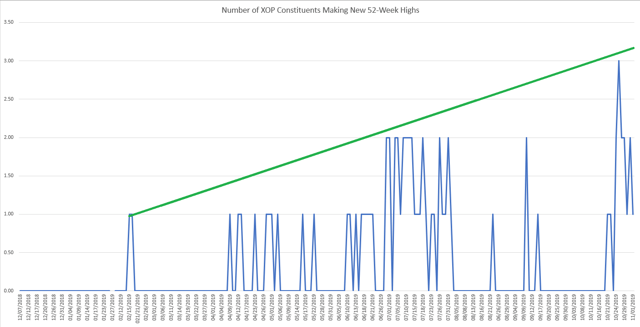
One of the ways that can sometimes help to gauge if an index is bottoming is to watch how many new 52-week lows are occurring amongst an index's constituents. Ideally, what we want to see is the number of components within an index making new 52-week lows dry up and begin to trend lower. This is what we've seen with the Oil & Gas Exploration & Production ETF, with lower highs in the index since December.
As we can see from the below chart, we saw a massive surge in new 52-week lows in December, with more than 85% of the index making new 52-week lows. Since that time, we saw a spike higher in August, and then a similar spike in early October.
However, these spikes have gotten less and less dramatic, and this is despite the index continuing to make new 52-week lows. This is suggesting that some names are unwilling to drop further, despite the index continuing to leak to new lows. It also indicates that the further drop to new lows in the Oil & Gas Exploration & Production ETF is likely due to the laggards of the group continuing to trend lower, while the best names are giving up ground less grudgingly.
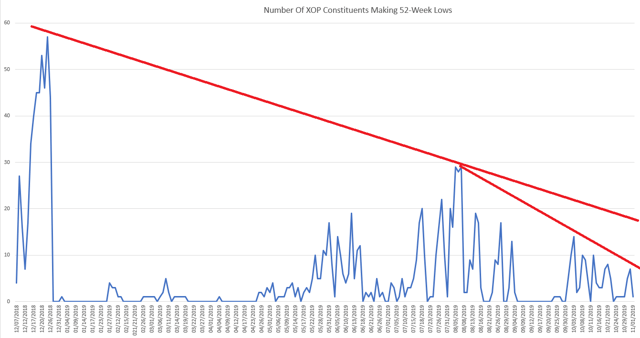
As we can see in the below chart of the Oil & Gas Exploration & Production ETF, three lower lows in the index since December have seen a trend lower in new 52-week lows among the index's constituents.
We saw 57 new lows at the December lows, 19 new lows at the June lows, 29 new lows at the August lows, and now only 14 new lows at the most recent lows. It is worth pointing out that we saw a bit of a divergence in June, and this quickly saw the index fall apart and drop 10% to new lows.
Therefore, this divergence we see with less new 52-week lows could end up being erased just as it was in June. This indicator does not provide guarantees; it just gives investors a look under the hood to assess if things are improving. I would argue they are internally, but the final arbiter is always the price, and price action remains listless for the time being.

52-Week Highs
If we take a look at new 52-week highs among constituents in the index, we also see a minor divergence. Despite the Oil & Gas Exploration and Production ETF making three new lows since December, the amount of new 52-week highs among constituents is trending up, albeit slightly.
We now have three names in the index that made new 52-week highs, and they are Phillips 66 (PSX), Valero Energy (VLO), and World Fuel Services (INT). This suggests that investors see value in the index despite its pathetic performance. While the trend higher we're seeing is minor, it is a positive sign to see some names beginning to buck this trend.
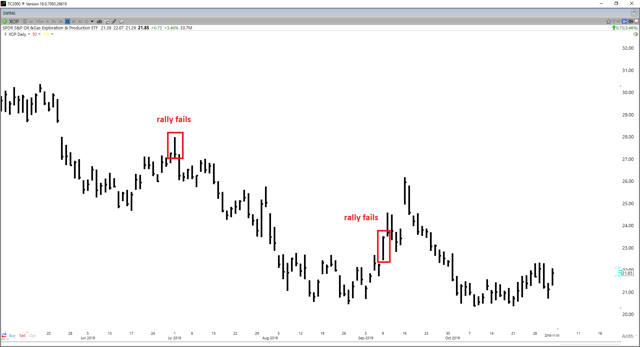
Between the amount of new 52-week lows trending down and the amount of 52-week highs trending up, there is some reason for optimism here. However, the first sign of a real bottom is a breakaway rally that does not look back. While it looked like we might have had this on July 1st and September 9th, these rallies were thwarted immediately by the bears. If we could see a 3.50% or larger daily gain that holds its gains, and is not retraced almost immediately, this would be a positive sign.
So how does the technical picture look currently?
The Oil & Gas Exploration & Production ETF remains in a steep downtrend, with resistance levels stacked overhead at $24.80, $28.00, and $33.00. Pivotal weekly support sits at $20.90, and two weekly closes below this area would be a negative sign and dampen the technical picture further. For now, any drops below this level have been shake-outs, and it looks like buyers are stepping in on the drops. As long as the $20.90 level can be defended on weekly closes, I believe there is a reason to be optimistic about the potential for a bottom.
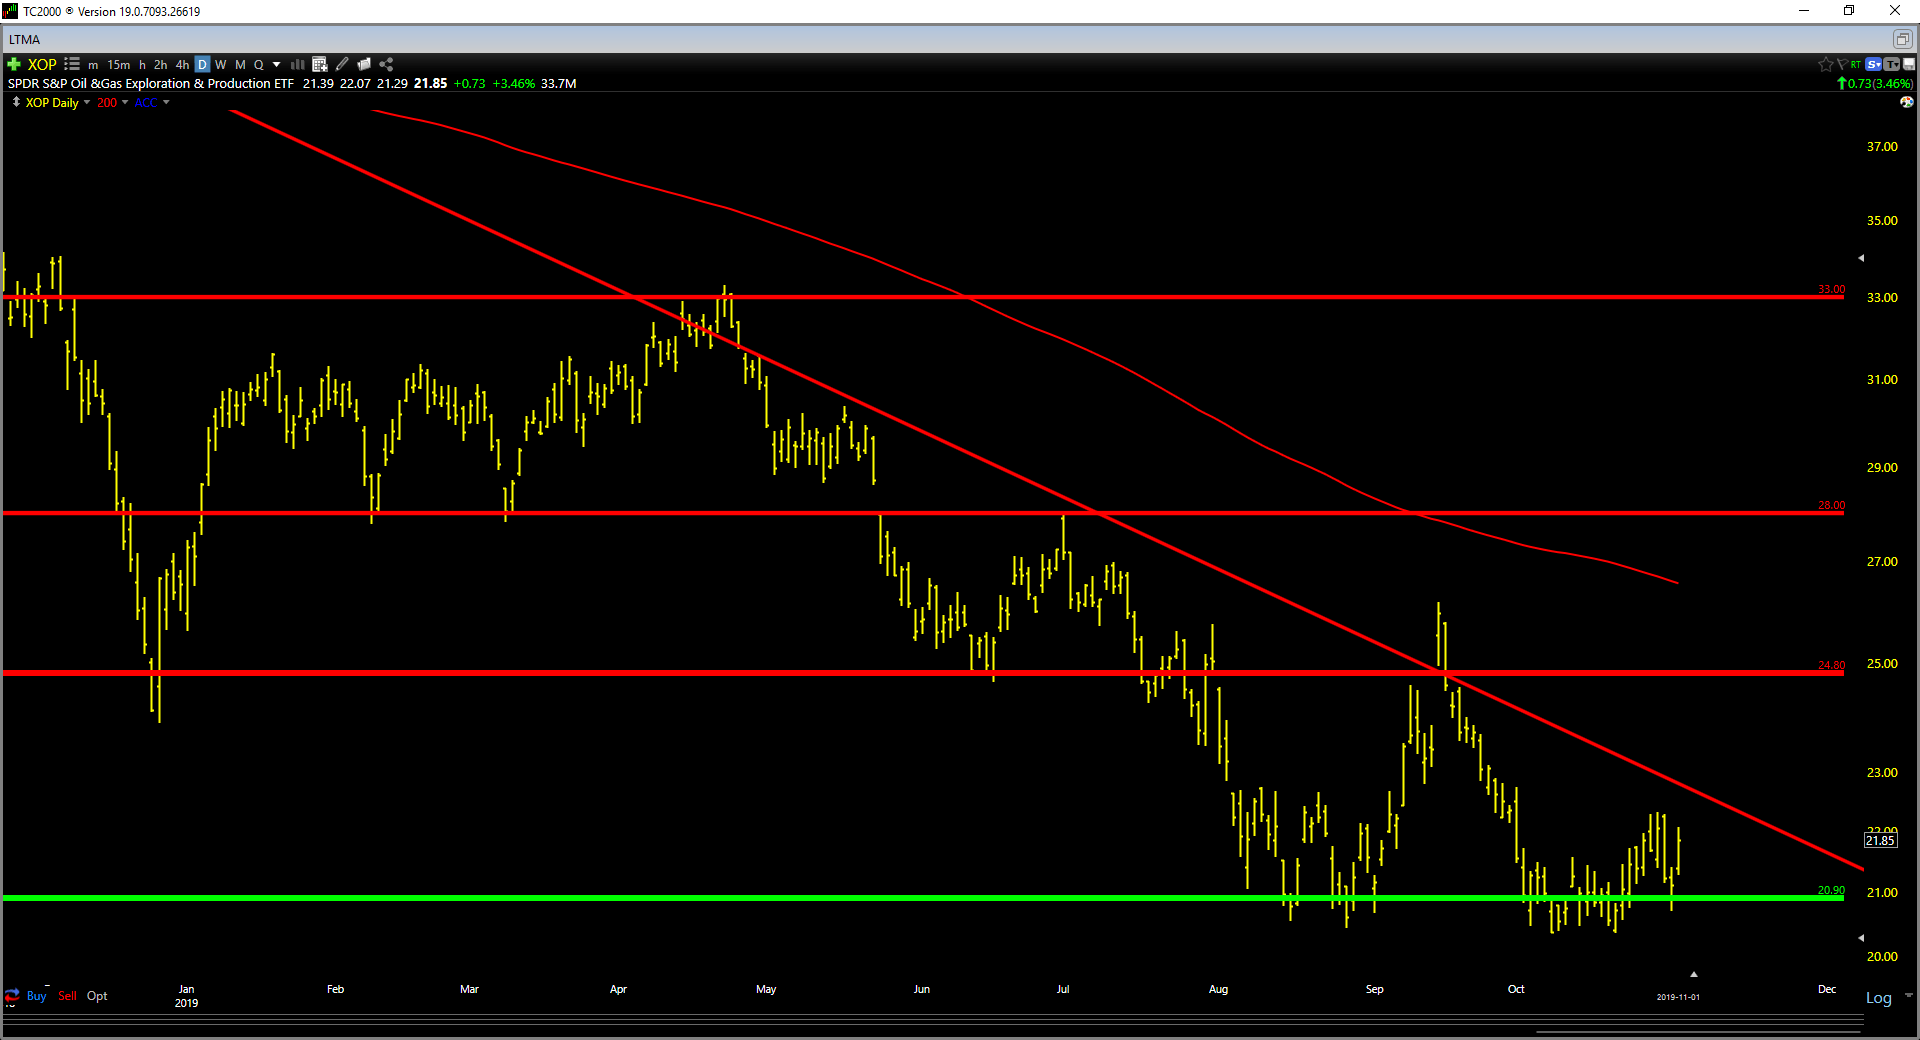
The first sign of a real bottom developing, however, would be a weekly close above the $24.80 level. This would represent a break of the current downtrend line, as well as a change in character for price action. The reason for this is that the past rally to this level fell apart almost overnight.
If I were interested in playing for a potential bottom, I would be using the higher-quality names above $20 billion market-caps, rather than the index. Some of these names have given up ground more grudgingly, and look to have bottomed, despite the index still sitting near its lows. I was briefly long Phillips 66 in Q3 and sold out my position above $118.50. However, I may consider going long the stock again if it can set up correctly.
To summarize, I believe the Oil & Gas Exploration & Production ETF is an index worth watching for investors. We continue to hear arguments for peak oil and that oil stocks are going out of style, but I would argue that this consensus is occurring during the worst sentiment for the index in years. While this thesis could end up being true, it's unlikely that the index is going to entirely fall apart once again when everyone is looking in the same direction. As the famous investor Jim Rogers said: "I just wait until there is money lying in the corner, and all I have to do is go over there and pick it up." I believe we are finally nearing that point for some oil stocks, but a weekly close above $24.40 will be needed to confirm a bottom is likely in place.


