Summary
- In a flexible price monetary model, changes in the money supply should be immediately reflected in the exchange rate.
- A plot of the trade weighted US dollar in nominal terms shows the dollar appreciated at the time of the beginning of money expansion.
- US money/GDP has increased by about 22% since 2019Q4, while the nominal value of the dollar has decreased by about 12% (both in log terms).
Worried about currency debasement? Do we find out anything from the nominal exchange rate? In a flexible price monetary model (sometimes called the monetarist model of the exchange rate), changes in the money supply should be immediately reflected in the exchange rate.
Here's a plot of the trade weighted US dollar in nominal terms, shown so that a movement upward is a dollar depreciation. Also shown is M2 divided by real GDP. Both are shown on a log scale. According to the simple monetarist model, the dollar should've depreciated with the increase in money.
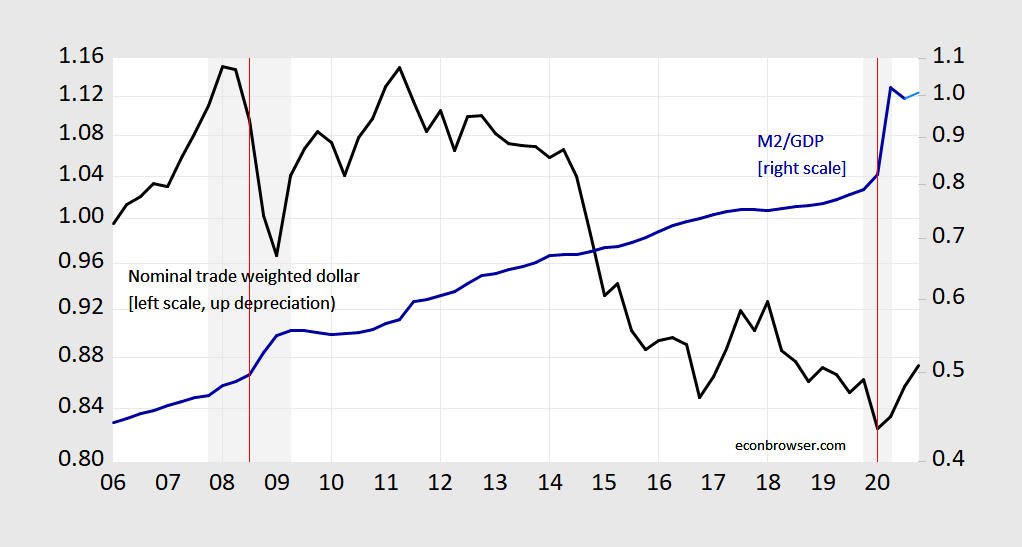
Figure 1: Nominal trade weighted dollar exchange rate at end of period (black, left log scale, up is a depreciation), and M2 to real GDP (blue, right log scale). 2020Q4 is for data through November, and GDP from WSJ December survey mean. NBER defined recession dates shaded gray. Red lines at Lehman Brothers bankruptcy, and Covid-19 pandemic in the US. Source: Fed and BEA via FRED, NBER, and author's calculations.
Notice that the dollar appreciated at the time of the beginning of money expansion; this could be attributable to safe-haven aspects. And further, rest-of-world money is not shown (in principle it's US money relative to foreign that matters). As time has gone on, the dollar has depreciated as the US money supply has remained elevated.
US money/GDP has increased by about 22% since 2019Q4, while the nominal value of the dollar has decreased by about 12% (both in log terms). Whether this is a lot - representing imminent debasement - depends on how much you think the rest-of-world money supply has increased, as well as whether you think the monetarist model is right. [US M2 y/y growth is about 25%, euro area at about 10%, China and Japan at 9%, and the UK at about 15% - not in log terms]
I don't - of course if one thinks prices are sticky, well, there should've probably been a bigger drop in the dollar given overshooting…


